Monitoring Website Traffic with GoAccess
One of the advantages of running your own web server is that you control the data. You don’t need a paid analytics platform to understand who is visiting your site, what they’re looking at, and when they’re most active.
On ScottHaight.com, I use GoAccess—a lightweight, open-source log analyzer—to turn Nginx access logs into a clean, real-time dashboard. This page walks through what you need, how it works, and how to read the output.
What You Need
-
An Ubuntu (or Linux) server running Nginx, with access to
/var/log/nginx/access.log. - sudo access so you can install packages and read log files.
- The ability to install GoAccess from your distro’s package manager.
-
Optionally, a web directory where you can publish an HTML report (in this case:
/var/www/scotthaight.com/html/analytics/).
How It Works
Nginx writes a line to its access log for every request to your site. Each line typically includes:
- Client IP address
- Timestamp
- Requested URL
- HTTP status code (200, 404, etc.)
- Bytes sent
- Referrer and user agent
GoAccess reads those log lines and builds a dynamic report showing visitors, requested pages, traffic over time, and more. You can run it in a terminal, or have it generate an HTML dashboard that updates in real time.
Why You Need It
- Visibility. Know whether anyone is actually hitting your site, and which pages they care about.
- Performance & Reliability. Spot spikes, unusual traffic, or repeated errors before they become problems.
- Security Awareness. Identify suspicious patterns: repeated 404s, brute-force attempts, or automated scans.
- Decision Support. Use data to decide what to improve, what to simplify, and what to build next.
Step-by-Step Setup
1. Install GoAccess
On Ubuntu:
sudo apt update
sudo apt install -y goaccess
2. Create an Analytics Directory
This is where the HTML report will be written and served by Nginx:
sudo mkdir -p /var/www/scotthaight.com/html/analytics
sudo chown www-data:www-data /var/www/scotthaight.com/html/analytics
sudo chmod 755 /var/www/scotthaight.com/html/analytics
3. Generate a Real-Time HTML Report
The command below tells GoAccess to read the Nginx access log, generate a report, and keep it updated in real time:
sudo goaccess /var/log/nginx/access.log \
  -o /var/www/scotthaight.com/html/analytics/report.html \
  --real-time-html --log-format=COMBINED
While this command is running, you can open:
https://scotthaight.com/analytics/report.html and watch live traffic as it comes in.
4. Optional: One-Time Static Report
If you just want a snapshot instead of a live dashboard:
sudo goaccess /var/log/nginx/access.log \
  -o /var/www/scotthaight.com/html/analytics.html \
  --log-format=COMBINED
Then open https://scotthaight.com/analytics.html in your browser.
How to Read the GoAccess Report
Once the report is generated, GoAccess presents the data in sections. Here’s how to interpret the main areas, with real examples from ScottHaight.com.
1. Overview / Summary
At the top of the report, you’ll see summary numbers: total requests, valid requests, failed requests, unique visitors, requested files, and more. This gives you a quick sense of how busy the site has been over the selected time range.

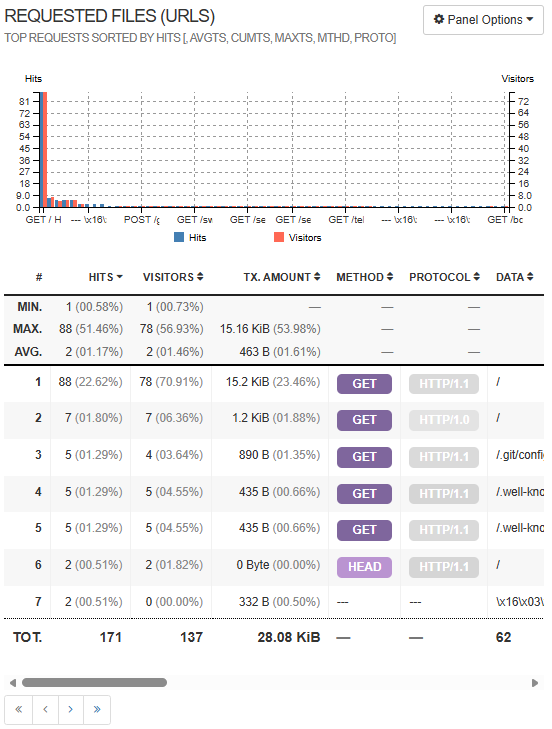
2. Requested URLs / Top Requests
The “Requested URLs” section shows which pages are being accessed most often—for example:
/, /resume.html, /downloads/Scott_Haight_Resume.pdf, and so on.
This tells you what visitors are actually looking at. It’s especially useful when deciding where to focus content improvements or which pages to optimize.
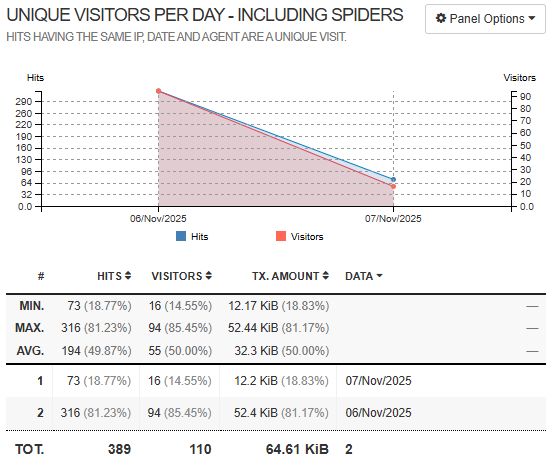
3. Visitors Over Time
Time-based panels show how traffic is distributed—by hour, day, or other intervals. This helps you understand when people are most likely to visit, and can hint at which time zones are most active.
For personal branding or portfolio sites, this is a simple way to see when posts or shares are driving traffic back to your site.
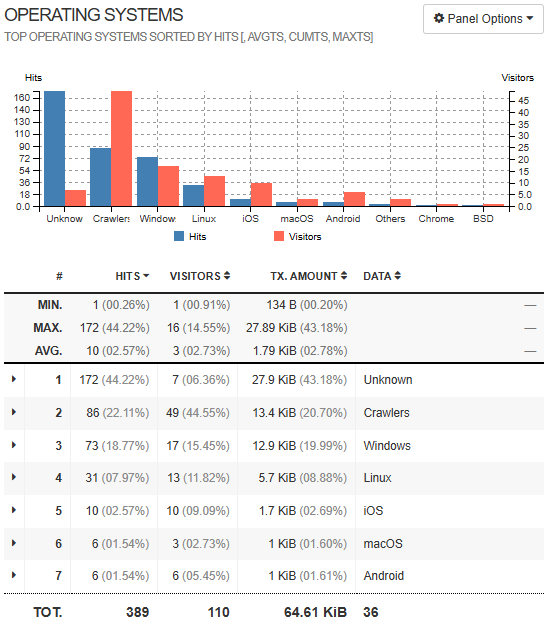
4. Clients, Browsers, and Operating Systems
Additional panels break down user agents—browsers, operating systems, and sometimes devices. This helps you understand how people access the site (desktop vs. mobile, different browsers) and whether any automated tools or bots are responsible for a noticeable portion of the traffic.
Security & Access Considerations
-
Protect the Analytics Page.
It’s a good idea to restrict access to/analytics/using HTTP basic auth or IP-based controls so that only you (or your team) can see detailed visitor data. -
Respect Privacy.
IP addresses and user agents can be sensitive data. Store logs responsibly, and avoid sharing raw data publicly. -
Rotate Logs.
Uselogrotate(Ubuntu’s default) to keep log sizes reasonable and maintain a healthy retention period without filling your disk.
Why This Matters for Operations Leadership
For me, this setup is more than a personal analytics tool. It shows how you can take a simple, free solution and use it to build visibility into a live environment—no external SaaS required.
It reflects the same philosophy I apply to larger environments: measure what matters, keep an eye on behavior over time, and turn raw data into decisions that make systems more reliable and user-friendly.